The Hammer Pattern
Trade what you see, not what you think!
What is a hammer?
A hammer is a single candlestick that forms at the bottom of a downtrend: a small body at the top of the candle's range, a long lower wick at least twice the size of the body, and little or no upper wick. It shows that sellers pushed price down during the session and buyers pushed it back up before the close.
The name comes from the shape: a small head at the top and a long handle hanging below it — a hammer, head up. The story inside the candle is a fight. Sellers had control early and drove price to a new low; buyers answered inside the same session and carried price back up near the open. One candle cannot reverse a trend by itself, so a hammer is a warning that the selling may be tiring — a signal to pay attention, confirmed only by what the next candle does.
How to spot a hammer
- Check the trend first. A hammer only means something at the bottom of a downtrend. The same shape at the top of an uptrend is a different candle (a hanging man) with the opposite read. No downtrend, no hammer.
- Find the small body at the top. The open and close sit close together near the top of the candle's range. The body can be green or red — green is the stronger look, because price closed up on the session — but the shape and the location matter more than the color.
- Measure the lower wick. The wick hanging below the body should be at least twice the size of the body. That long tail is the whole point: it is the record of sellers pushing down and failing to hold the low.
- Check the top. There should be little or no upper wick. A long upper wick means buyers got pushed back down from higher prices — a different story, and not a hammer.
- Wait for confirmation. The next candle has to close higher — ideally above the hammer's high. That follow-through is buyers proving the pushback was real. No confirmation, no signal.
- Name the invalidation before you act. The low of the wick is the line. A close below it ends the idea. If you cannot say what proves you wrong, you do not have a setup yet.
Get the free 5-Pattern Guide
You can spot the hammer now — the guide drills it until it is reflex. The free 5-Pattern Guide covers five essential patterns — the recognition rules, the invalidation, and what usually happens next — in a 7-page visual sampler. Enter your email and it lands in your inbox. It ships with AI study files and the Knight Trader MCP Study Server — plug it into your own AI and get taught and quizzed on every pattern.
Download the free 5-Pattern GuideAnatomy of a hammer
The walk-through below is an illustrative example of the shape, drawn to teach it. It is not a trade result — no entry, exit, or profit is being reported.
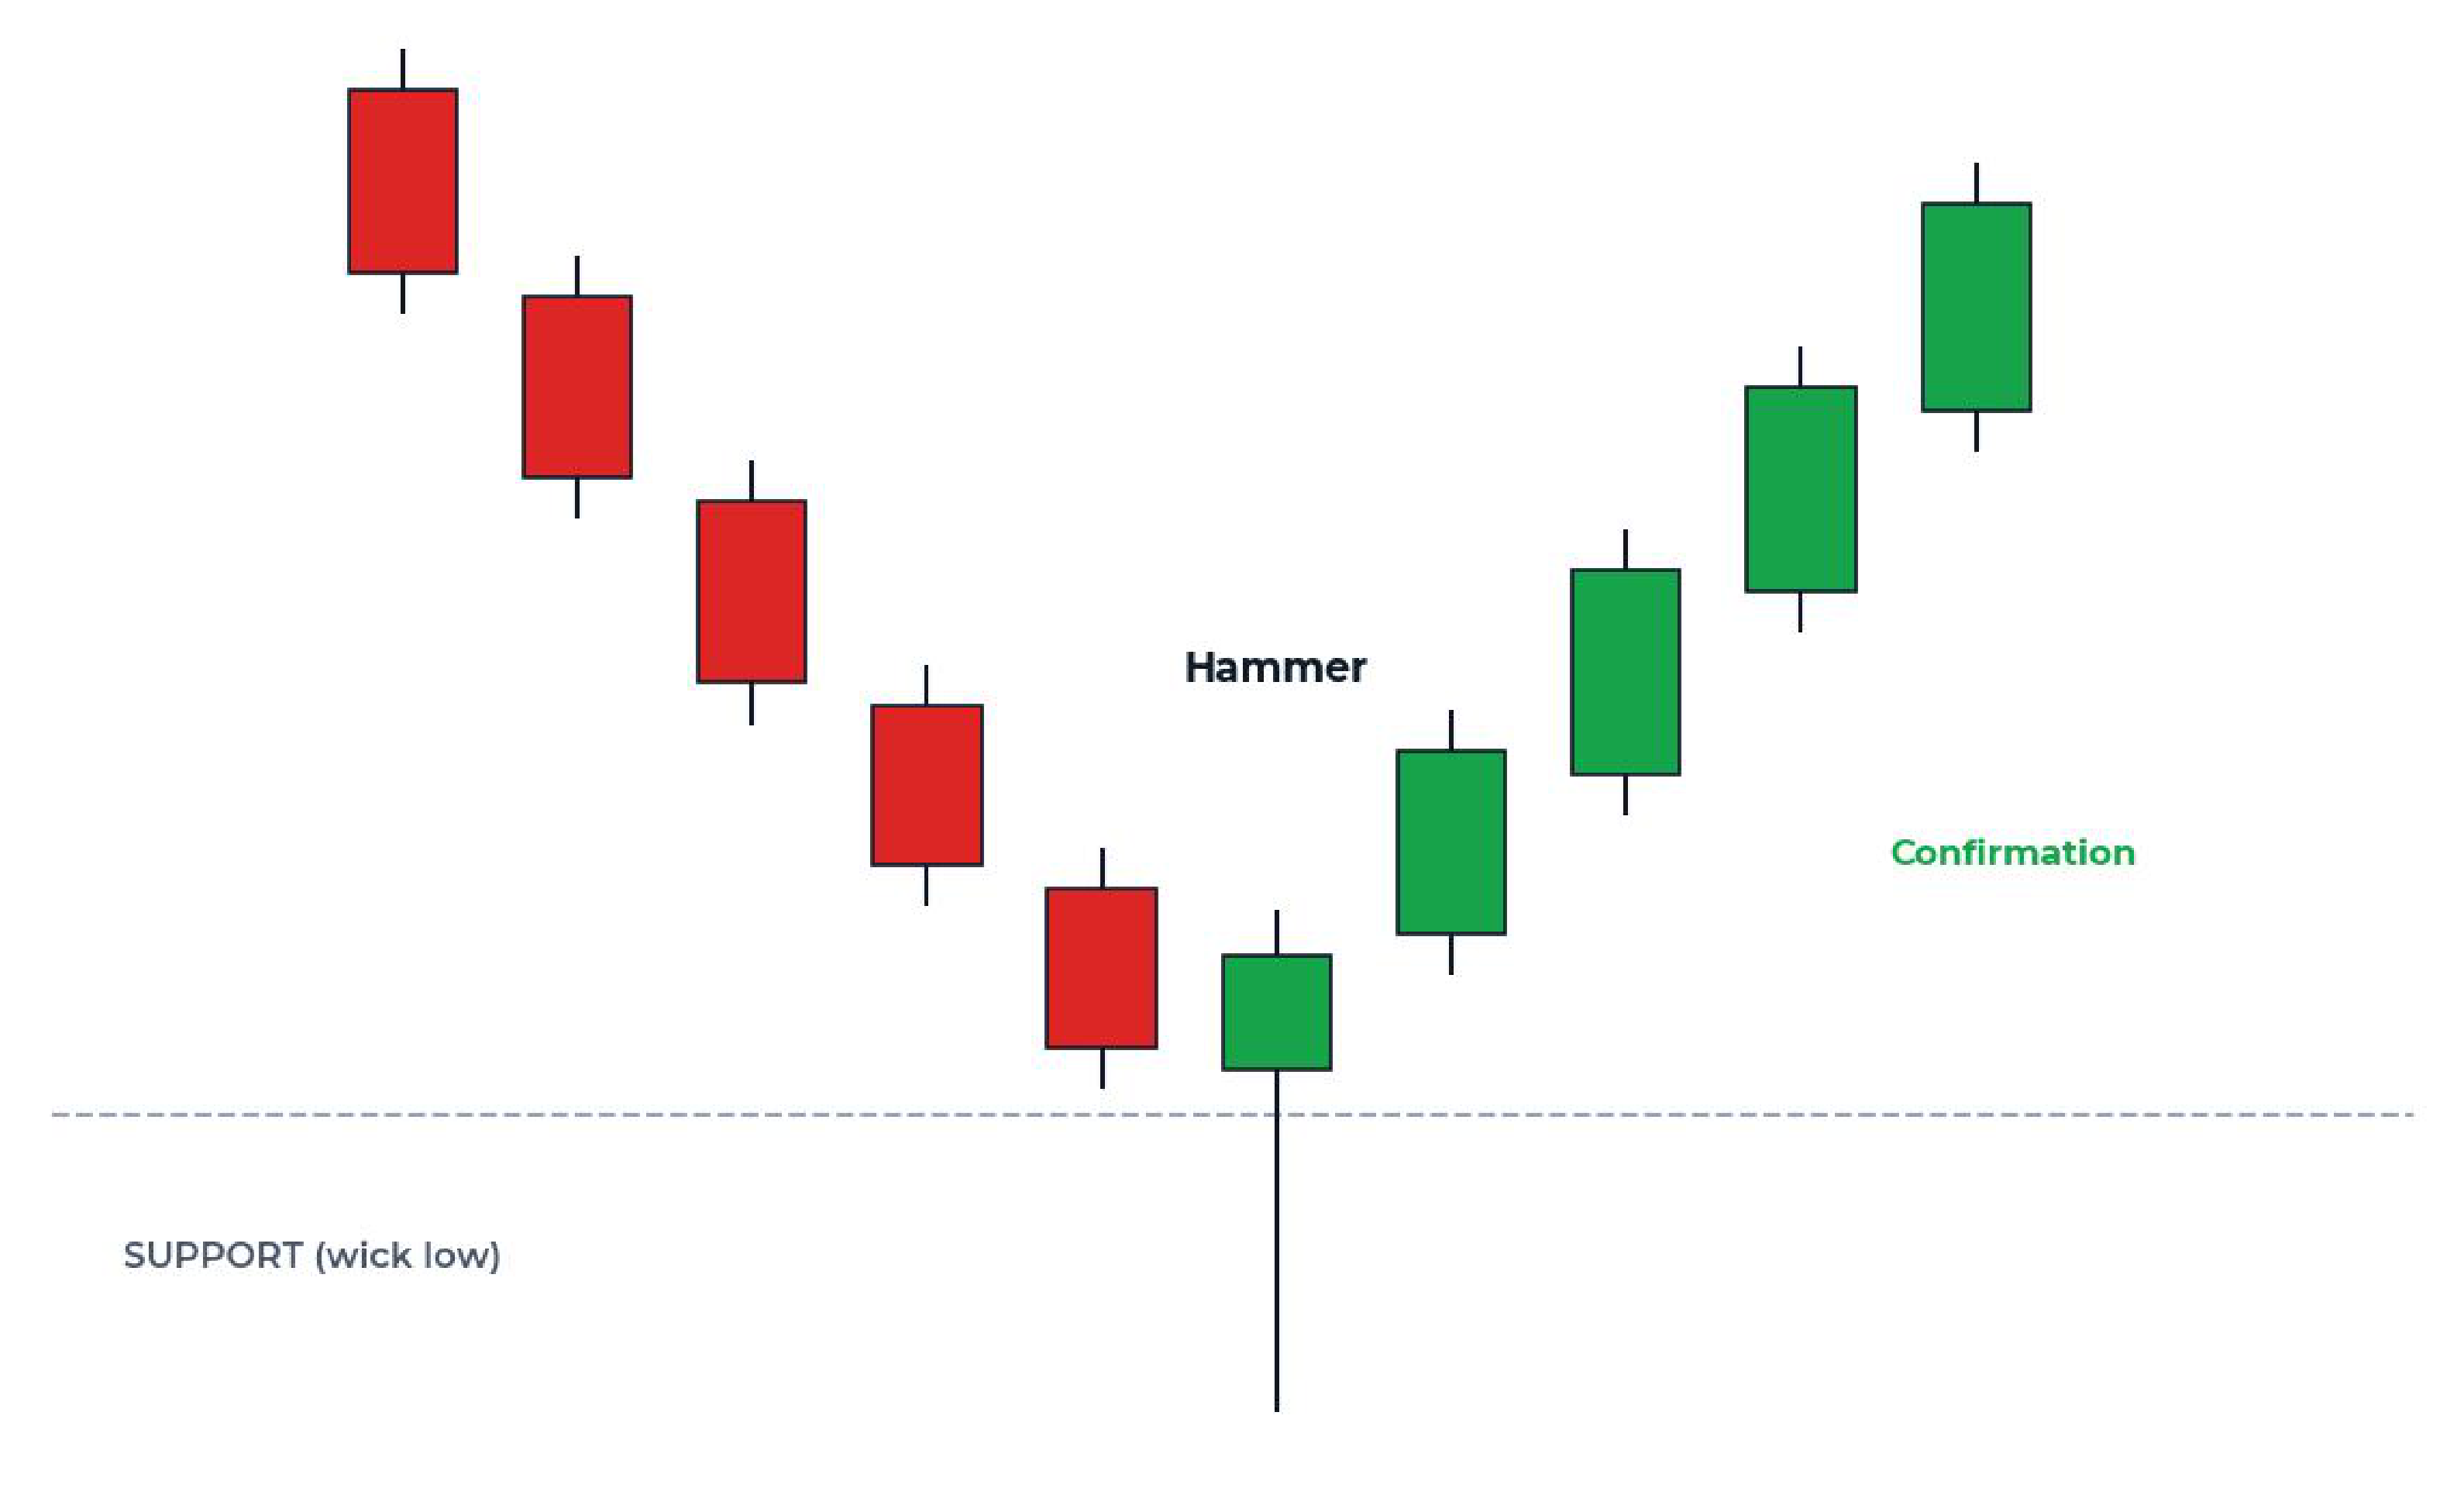
Picture a stock that has been falling for days — a staircase of red candles, each one closing lower than the last. Then comes the candle that looks wrong. Price drops again during the session, lower than anywhere the stock has been, but it does not stay there: by the close, price is back up near the top of the day's range. That candle is the hammer. Its long lower wick is the footprint of the session's fight — sellers swung, and the low they made was rejected.
The wick's low is the line that matters. In the picture above it pokes through the support line — the level where the earlier selling had paused — and snaps back. That rejection is the read. What turns the read into a pattern is the confirmation: the candles after the hammer close higher, showing buyers following through instead of the one-session bounce dying out. And the invalidation is just as clear: a close below the wick's low says the buyers' stand failed, and the hammer read is over.
Three things make the picture work: the downtrend before it (the hammer needs something to reverse), the shape itself (small body, long lower wick, nothing on top), and the confirmation after it. Lose any one of the three and you no longer have a hammer.
Common hammer mistakes
- Calling it a hammer anywhere on the chart. Location is half the pattern. The same candle in the middle of a range or at the top of an uptrend is not a hammer — read the trend before you read the candle.
- Acting before confirmation. A hammer is one candle telling a story. Until the next candle closes higher, the story is unproven. Buying the hammer itself is guessing, not reading.
- Accepting a short wick. If the lower wick is not at least twice the body, the rejection was not strong enough to earn the name. Near-hammers are just candles.
- Ignoring a long upper wick. Buyers who got shoved back down from the highs are part of the story too. A big upper wick changes the candle — and the read.
- Trading without an invalidation. The wick low is right there on the chart. If you cannot say “a close below that ends it,” you are hoping — and hope is not a level.
- Expecting one candle to reverse a strong downtrend alone. A hammer is a first sign, not a guarantee. Strong downtrends can print a hammer and keep falling; the confirmation candle exists precisely because of that.
Hammer FAQ
What is a hammer candlestick pattern?
A hammer is a single candlestick that forms at the bottom of a downtrend: a small body at the top of the candle's range, a long lower wick at least twice the size of the body, and little or no upper wick. It shows that sellers pushed price down during the session and buyers pushed it back up before the close.
How is a hammer confirmed?
The candle after the hammer confirms it: a following candle that closes higher — ideally above the hammer's high — shows buyers following through. Without that follow-through, the hammer is only a shape, not a signal.
What is the difference between a hammer and an inverted hammer?
The wick points the other way. A hammer has a long lower wick and a small body at the top; an inverted hammer has a long upper wick and a small body at the bottom. Both appear at the bottom of a downtrend and both need a confirming candle after them.
What invalidates a hammer?
A close below the low of the hammer's wick. That low is where buyers made their stand; if price closes under it, the stand failed and the hammer read is over.
Get the free 5-Pattern Guide
The hammer is one candle in a 32-pattern library. The free 5-Pattern Guide covers five essential patterns — the recognition rules, the invalidation, and what usually happens next — in a 7-page visual sampler. Enter your email and it lands in your inbox, and you're on the list for the daily market weather and new pattern lessons as they publish.
It ships with AI study files and the Knight Trader MCP Study Server — plug it into your own AI and get taught and quizzed on every pattern. Study with your own AI, on your schedule.
Download the free 5-Pattern GuideFree first. When you want the whole library: the 32 Candlestick Patterns collection ($20) covers all 32 patterns. I show what the charts say — you decide.
Keep learning
The bull flag — a continuation pattern, the hammer's opposite number — has its own free lesson: The Bull Flag Pattern. Want the rest of the pattern library? The free 5-Pattern Starter Guide covers five essential patterns in a 7-page visual sampler, and the 32 Candlestick Patterns collection covers all 32. Or go back to all education.
Back to Education